Changelog
Follow up on the latest improvements and updates.
RSS

We've added new detailed cards that will provide you a summary of progress when you hover over a metric or the confidence square of a specific goal.
This glance card will show you:
- Target detail
- Latest progress value
- Previous progress value
- Change variance since the last update
- Progress bar
This is available in your plan dashboard, strategy map, inbox and filters.

You can now connect Tability to Sentry to automatically pull data for your check-ins.

We have added 4 new widgets that you can use in your custom dashboards:
- Text block
- Goals vs. tasks progress
- Goals progress distribution
- Goals confidence distribution

We have completely revamped our dependencies management in Tability.
Prior to today, relationship could only be established between outcomes/key results. Now you can also add objectives as dependencies of other objectives and outcomes.
We also made it possible to expand dependencies across multiple levels. This will allow you to traverse all dependencies in your workspace from the top-level plans.

We've improved the sharing options to allow you to share dashboards, reports, and views to specific emails.
- You can mix both workspace users and custom emails

One of our recommended best practice is to avoid having too many consecutive "at risk" statuses in a row.

This is now part of Tability! The platform will warn users during their check-in if they are about to have more than 3 yellow statuses in a row.
You can go one step further in the plan settings to enforce the limit:
- Go to your plan settings
- Turn on the option to Prevent consecutive "at risk" check-ins
- Select the limit

You can now toggle the style of the TV dashboard between dark and light mode.
You'll find that option next to the share button once you access the TV mode of your plan.

You can now see the list of people that are following you as well as manage the people you follow from your focus dashboard.
What are followers for?
Noise becomes exponentially louder as companies grow. A team of 5 will have 10 different lines of connections between all individuals. Add one more person and the number jumps to 30.
In this situation it becomes crucial to have simple ways to reduce the noise. And that's where followers can come in handy.
Following users will allow you to filter status reports and notifications in various places. For instance, you'll be able to filter check-ins from:
- Your direct reports
- Your stakeholders
- Your close teammates and peers
Hope that you'll enjoy this feature!

As teams scale, keeping up with status updates can feel like drinking from the fire hose. A simple way to fix that is to give you more options to reduce the noise by focusing on the plans, people, and teams that matter the most to you.
There are now 2 more filters available in your focus feed. You can now:
- Isolate updates from people that you follow
- Isolate updates from teams that you are a part of
How to use it:
- Go to your Focus dashboard
- Scroll down to the feed
- Select any of the filtering options

In most companies, people have a handful of team goals that they care about. The selection might be different for each person, but it's unlikely that you need to see everything, everywhere, at once.
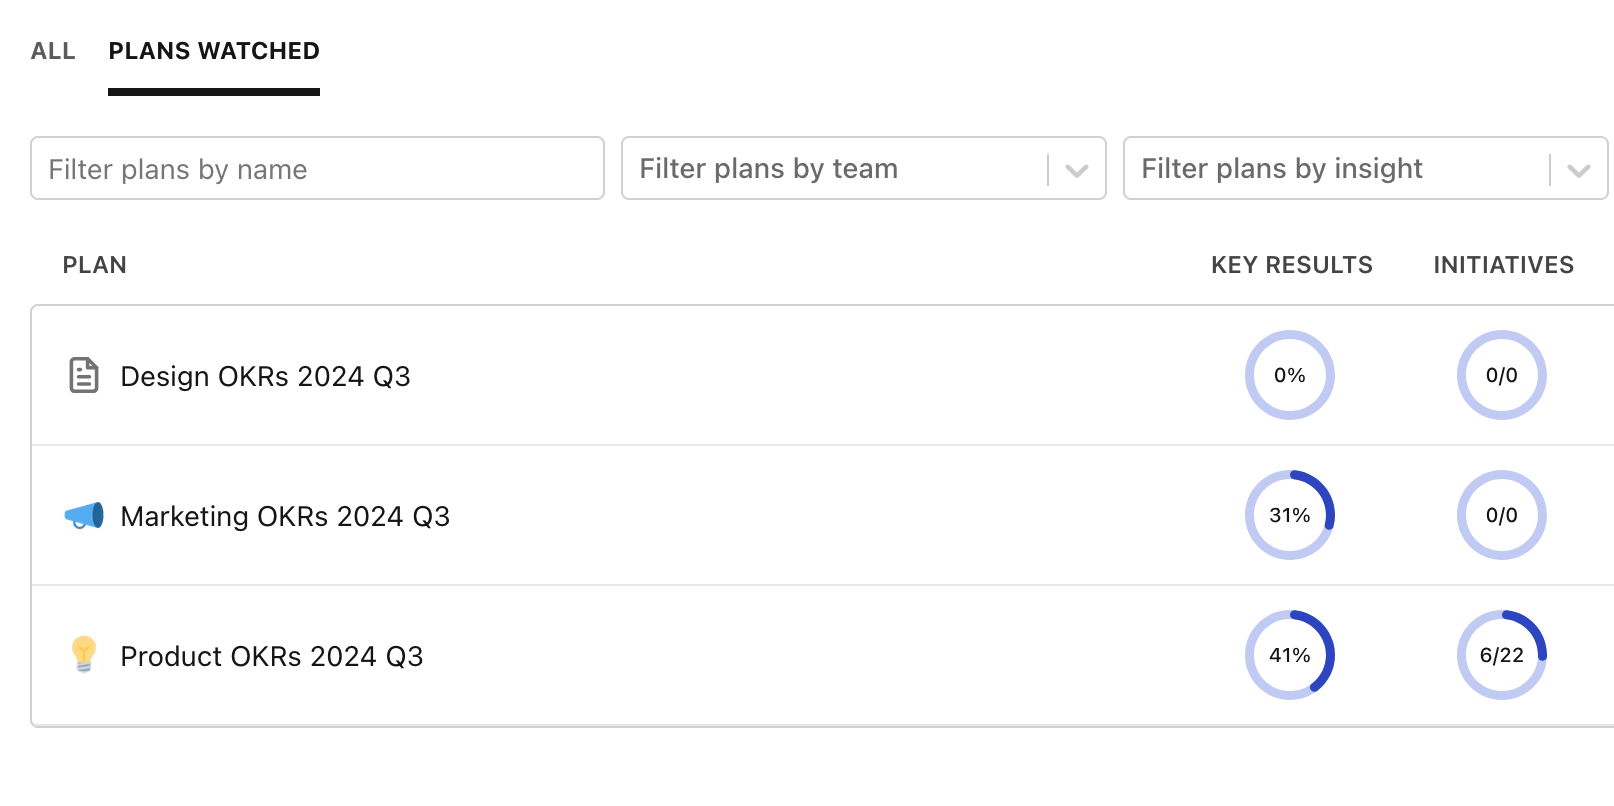
In Tability, this means that you probably want quick access to the plans that you're watching. We've made that easier today by adding a "Plans watched" tab that will show in a listing all the active plans that you're watching.
This is one of these tiny improvements that can save you a lot of time every week!
Load More
→